To see your financial reports, go to Financials from the Fincent dashboard. Your financial dashboard consists of the following:
This is your Summary. You can filter it by the time period - this year, this quarter, last quarter or even last year.

Next up is a graph of your Net Profit across the time period you’ve selected. You can see your income, expenses, and profit for each month here.

The Income section helps you assess how you earned over time, who contributes to your income, and what services bring in the money.

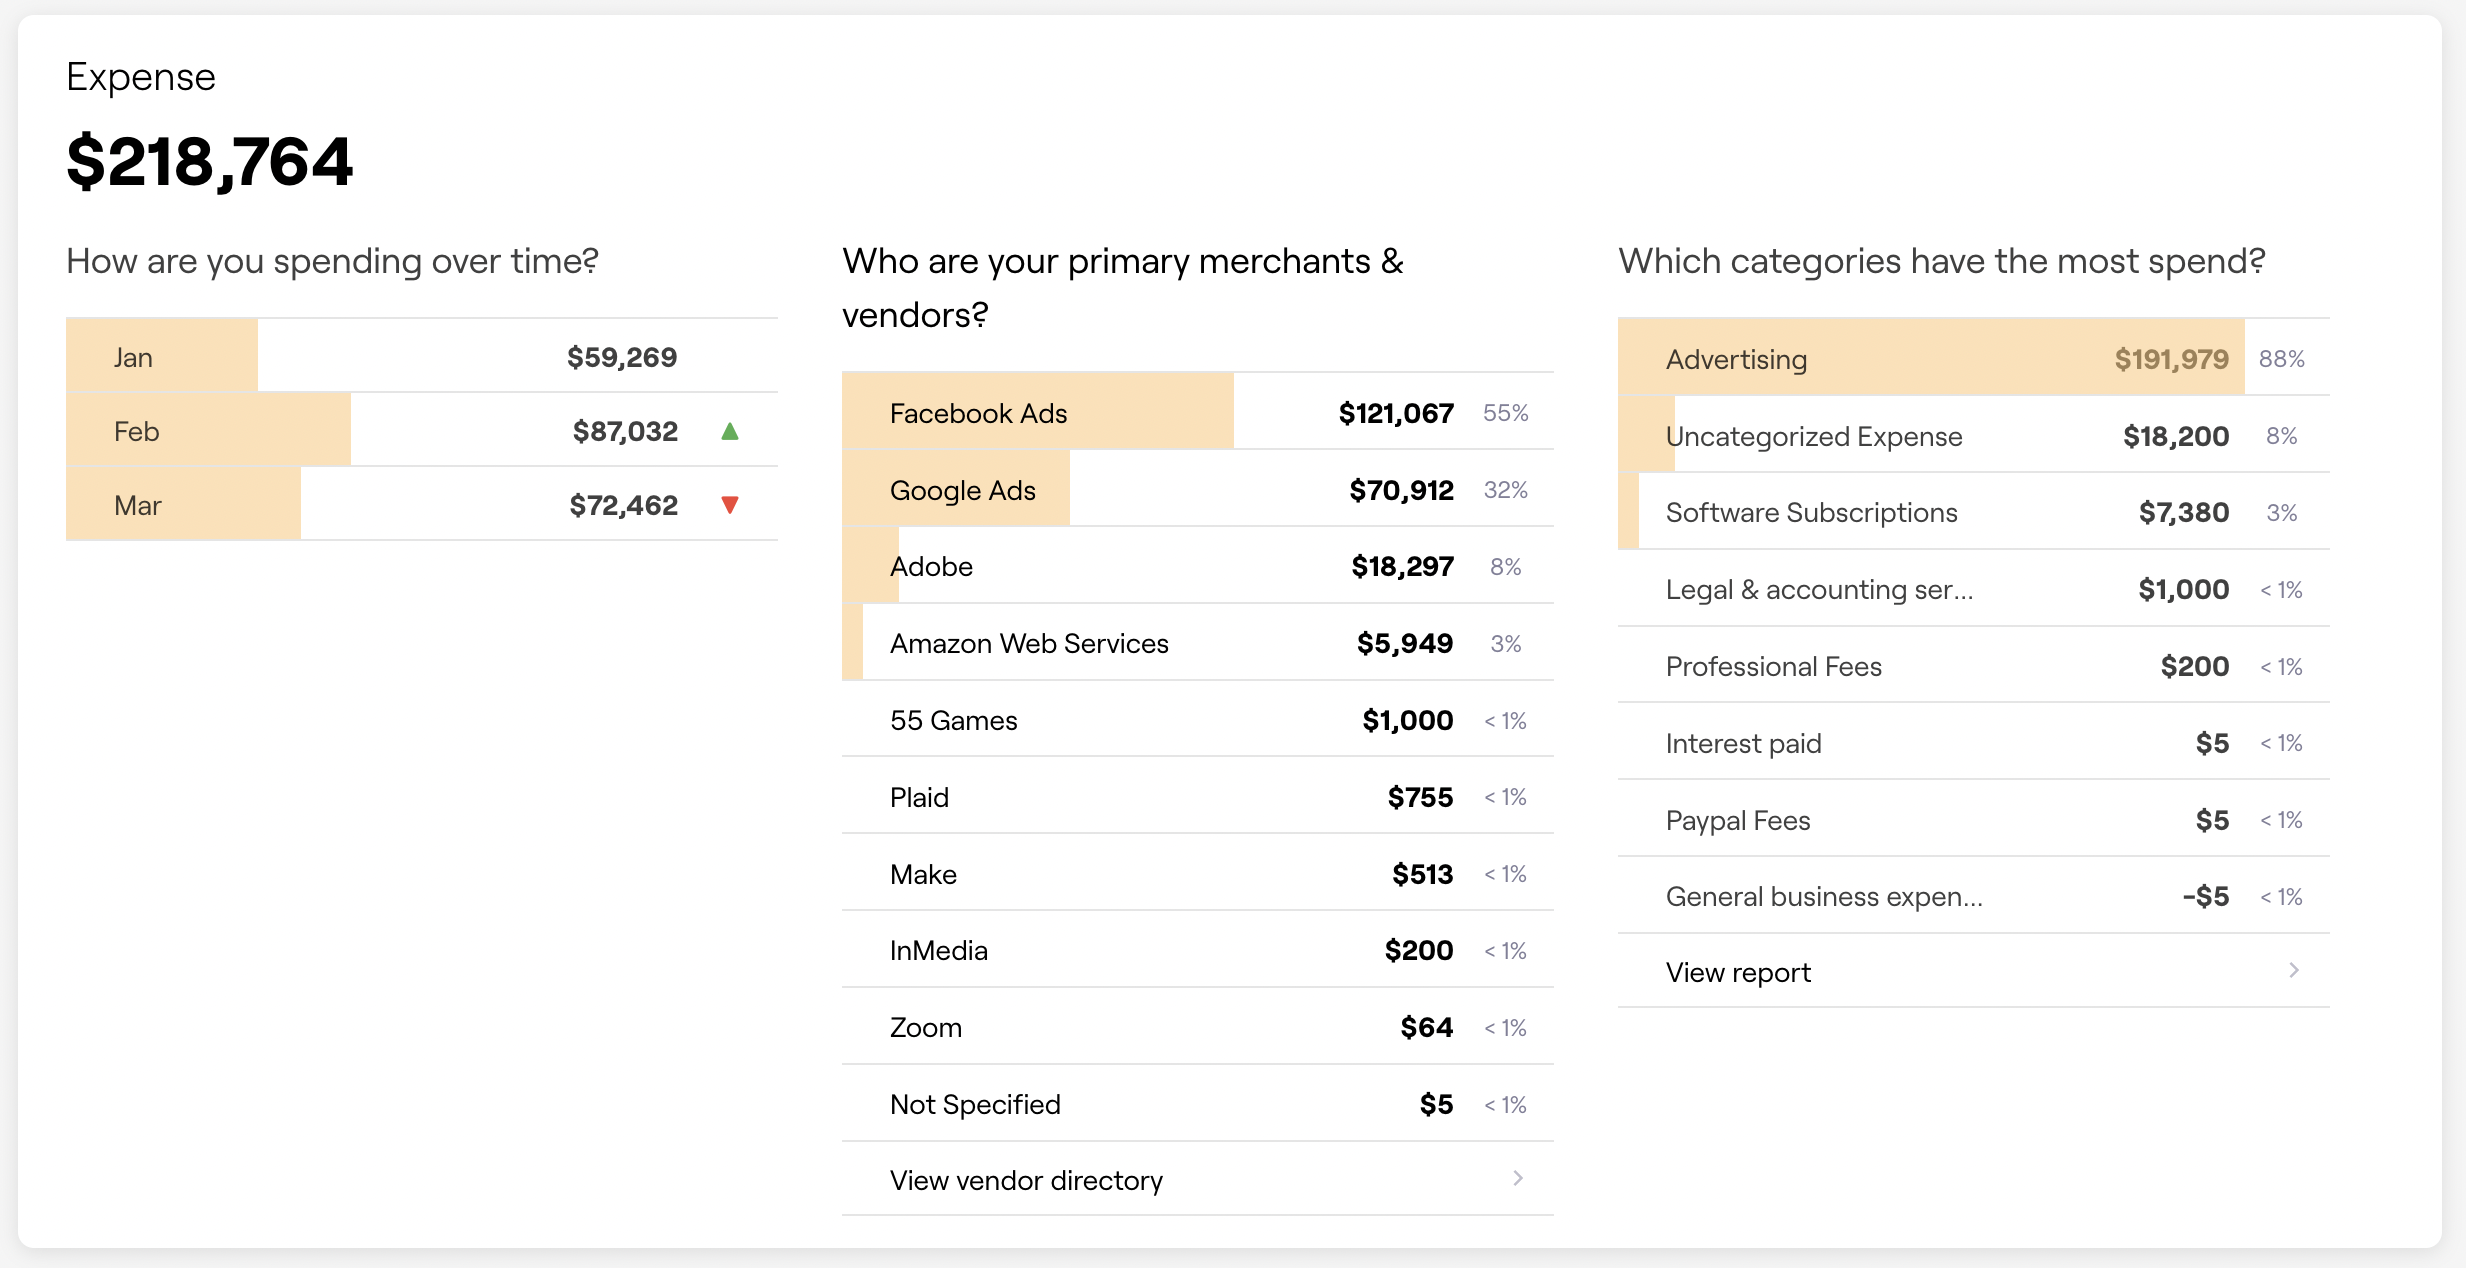
Similarly, the Expense section shows what your spending looks like over time, who your primary merchants and vendors are, and which categories have high spends.
You can even view your Cash Flow Statement, Balance Sheet and your Profit and Loss Statements in the adjoining tabs.
